HTML report
php
stopwatch()->checkpoint('First checkpoint');
stopwatch()->checkpoint('Second checkpoint');

{{ stopwatch()->render() }}
Or the Blade directive:
blade
@stopwatch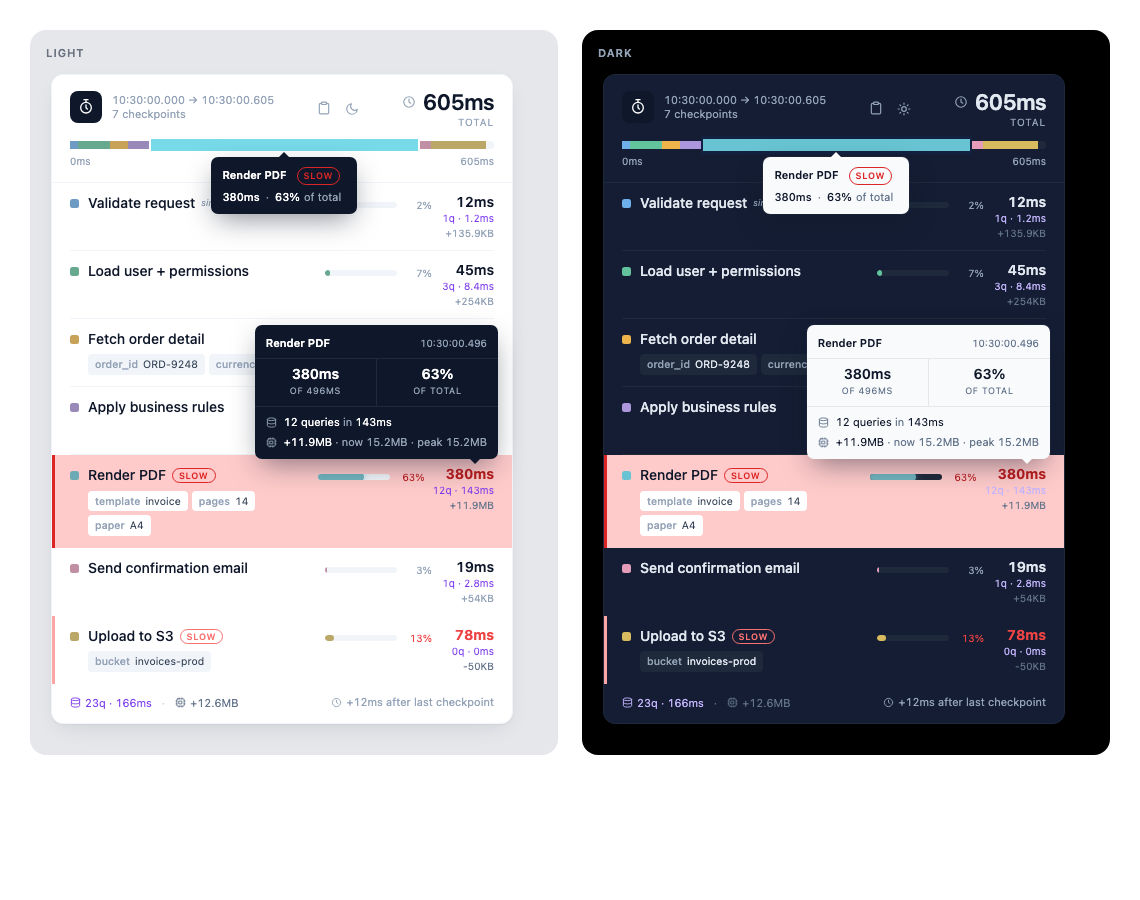
Every style is inline, so the card drops into any host page or email body without picking up surrounding CSS.
What the card shows
- Duration formatting that scales the unit:
3.4ms,143ms,1.25s,1m 5s. Also public:Stopwatch::formatDuration(1247). - Slow severity tiers. Light (1–2×), medium (2–5×), heavy (5×+) past
slow_threshold, so a barely-slow row reads differently from a hopeless one. - Overview bar with one segment per checkpoint, sized by share. Hovering a row cross-highlights its segment.
- Row tooltip with the full label, timestamp, delta, share, and query and memory metrics.
- Click a row for a modal with all metadata, memory current/delta/peak, every captured query (SQL, bindings, duration), and every HTTP call.
- Footer totals for query count and time, HTTP count and time, and memory delta.
- Copy as Markdown in the header, for pasting into a chat or a bug report. Also
stopwatch()->toMarkdown().
Theming
The card follows prefers-color-scheme and carries a toggle that persists in localStorage under sw-theme. Without JavaScript it falls back to the system preference and hides the toggle.
To re-skin it, override the CSS variables on .sw-stopwatch (or its [data-theme="dark"] variant): --sw-bg, --sw-text, --sw-border, --sw-hover-bg, --sw-tip-bg.
A @media print rule drops shadows, tooltips and the toggle and expands the card to full width, so a PDF export reads cleanly.