
Why Queue Insights?
Laravel ships queue:work and a failed_jobs table. During an incident you want to know how deep a queue is right now, which class is eating the workers, how long a job sat before a worker picked it up, and what its payload looked like when it blew up. None of that is in the box.
Horizon covers part of it, on Redis. Queue Insights covers it on whichever driver you already run: SQS, Redis, database, or Laravel Cloud's managed queues. Your job data never leaves your own infrastructure. The Redis keyspace it writes is bounded by your retention settings and evicts itself, so it doesn't grow without limit as job volume rises.
Live demo
queue-insights-demo.laravel.cloud, public preview hosted on Laravel Cloud, seeded with realistic fixtures.
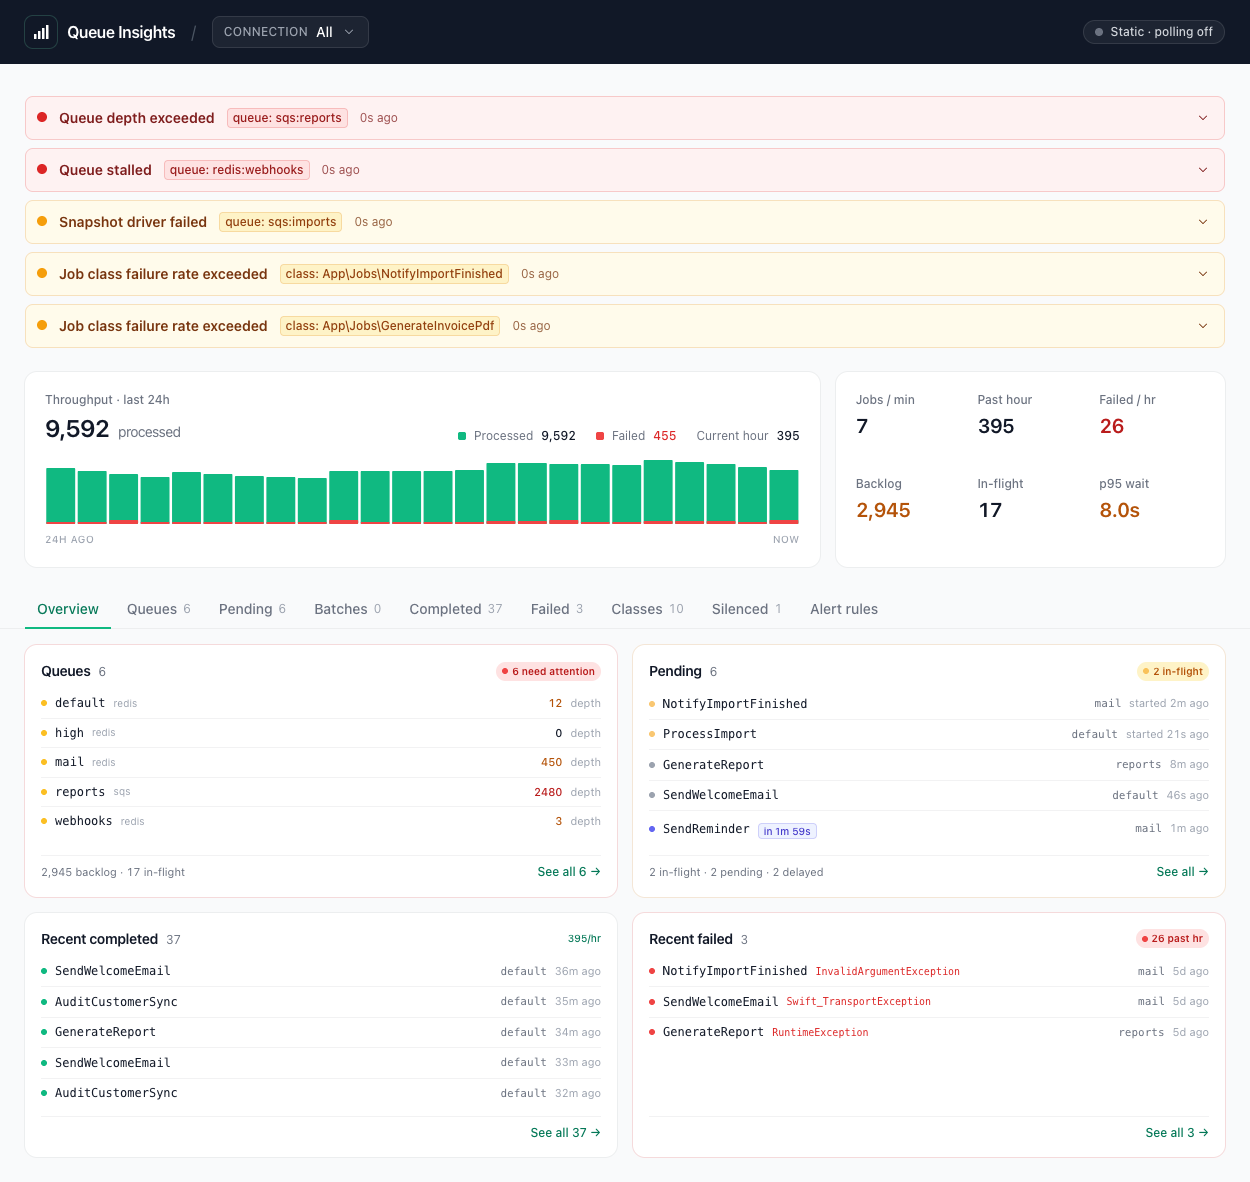
What you get
- Driver-agnostic depth, in-flight, delayed counts per queue, SQS, Redis, database, Laravel Cloud.
- Pending & delayed-job inspector per queue, event-captured into Redis (same view across drivers). Optional payload capture under a separate budget so the per-row hash math doesn't pin the completed-stream sanitiser settings.
- Batched jobs: per-batch progress, counts, cancelled state, per-item rollup linking back to job modals.
- Chained-job visibility:
↳ Nextchip + Chain modal section, plus opportunistic backward↰ From {parent}lineage. - Job initiator: every job records where it was dispatched from: a coarse origin (HTTP route / artisan command / scheduled task, propagated into nested dispatches via
Context) and an opt-infile:linecall site. Surfaced in the completed / pending / failed modals. - Wait time per queue (p50 / p95) and per job, enqueue → pickup gap.
- 24h throughput sparkline + headline stats (jobs/min, past hour, max p95 wait + runtime). Optional 7th tile: total Redis bytes consumed by the package's keyspace.
- Queues grouped Needs attention vs Healthy so a broken queue can't hide in a long list.
- Per-class metrics: 24h processed / failed, avg + max duration, last run.
- Recent completed + failed lists with shared filter row (connection, queue, class, date range), per-page dropdown (10 / 25 / 50 / 100), all persisted in the URL. Failed rows surface runtime alongside Completed (computed via a 30 d
failed-runtime:{uuid}side-key written when the worker'sstart:stamp survives toJobFailed). - Global queue + class scope across every section. Click a queue row in the Overview section's queues tables or a class row on the Classes section to scope Failed, Completed, Pending, Classes, and Silenced lists in one move. URL-shareable (
?qk={conn}:{queue},?ck={fqcn}); inline scope strip above the section panes shows the active scope with per-chip clear; click an already-selected row to toggle off. Scoping a silenced class auto-reveals its rows on Failed + Completed. - Retry badge: pending, in-flight, and completed rows render an orange
retry Nchip with hover tooltip when the worker has picked the job up more than once. Backed byattemptsstamped on thepending:{uuid}hash atJobProcessing. - Retry failed jobs from the dashboard, single or bulk, gated, rate-limited, audit-logged.
- Markdown export of failed-job details for AI-assisted triage or trackers.
- Sentry deep-link: when a failed job's payload carries sentry-laravel trace data, or a scheduled-task failure was captured by Sentry, the respective modal shows a View in Sentry button (and a Markdown-export line) linking to the matching Sentry issue. Opt-in via your org slug.
- Alerting: nine detectors (depth, stalled, oldest-pending, stuck-inflight, failure-rate, slow-p95, snapshot-errored, backlog-growing, connection-drift) with per-rule cooldown +
log/slack/mail/sentrychannels + typed events. - Prometheus: opt-in
/metrics(text + OpenMetrics), fail-closed auth, per-class cardinality control, optional scheduler metrics families, plus aprometheus-pushcommand for short-lived workers. - Scheduler observability: opt-in. Captures every
Illuminate\Console\Events\Scheduled*into per-task definition snapshots + per-run records (start/finish/exit/runtime/host/output), exposes a lazy-loaded dashboard panel with per-task + per-run drilldown modals (host-distribution chart, correlated-jobs section, exception block, output viewer, markdown export), ships a missed/hung sweeper, and routes scheduler alerts through the sameQueueAlertNotificationpipeline as queue alerts (log / slack / mail / sentry; per-domain channel block), typedScheduledTaskMissed/ScheduledTaskHung/ScheduledTaskFailedevents still fire alongside. - Horizon integration: supervisor queue auto-discovery from
horizon.environments,horizon.silencedmerged into our suppression filter, operator-declaredconnection_aliasescollapses dispatcher/worker connection drift onto a canonical key. - Light / dark / system theme with a tri-state toggle in the header. Persists per operator; default follows OS
prefers-color-scheme. - 12h / 24h clock toggle in the header (12h / auto / 24h).
autofollows browser locale + OS 24-hour preference. Persists per operator. - Standalone Livewire + Blade: no Filament or Nova coupling.
- Small, bounded Redis footprint: auto-evicting, no external observability service required.
- Redis Cluster compatible: opt-in (
QUEUE_INSIGHTS_REDIS_CLUSTER); hash-tag pinning keeps the keyspace on one slot so the package's multi-key Lua + pipelines stay CROSSSLOT-legal.